> ## Documentation Index
> Fetch the complete documentation index at: https://docs.cloudify.biz/llms.txt
> Use this file to discover all available pages before exploring further.
# Workflow Runs
> Track every integration execution — inspect run details, understand failures, and replay runs directly from the Lighthouse dashboard.
The **Workflow Runs** page is your real-time log of every integration execution inside Lighthouse. Every time a connected app sends an event — a new HubSpot deal, an updated contact, a completed order — Lighthouse creates a workflow run record that you can inspect, filter, and replay.
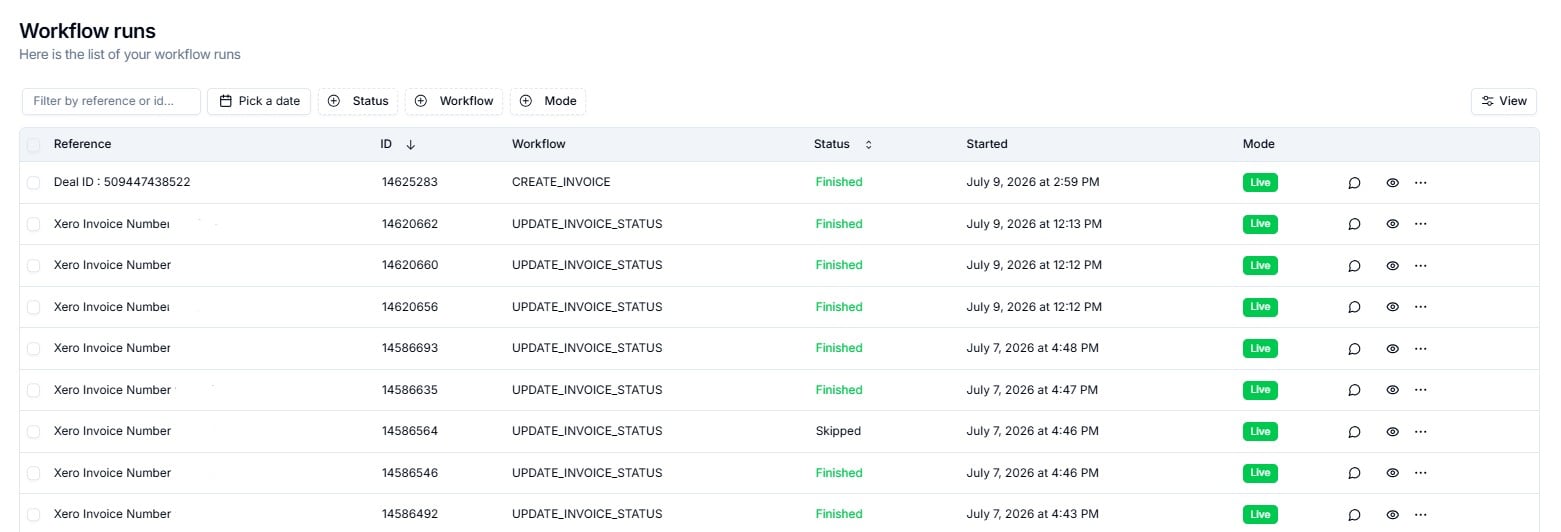 Use this page to answer three core questions:
* **Did my integration run successfully?**
* **If something went wrong — which step failed and why?**
* **Can I replay a run without waiting for the next trigger?**
***
## Reading the Runs List
Each row in the table represents a single workflow execution.
| Column | What It Shows |
| ------------- | -------------------------------------------------------------------------------------------------- |
| **Reference** | The source record that triggered the run — e.g. `HubSpot Deal ID: 49649660024` |
| **ID** | The unique numeric identifier for this run — e.g. `33222`. Always include this in support requests |
| **Workflow** | The integration that executed — e.g. `HubSpot → Xero Invoice` |
| **Status** | The run outcome: `Finished`, `Failed`, `Running`, or `Pending` |
| **Started** | The date and time the run began executing |
***
## Run Status Reference
| Status | Meaning | What To Do |
| ------------ | --------------------------------------------------------------------- | -------------------------------------------------------------------------------------------------------------------- |
| **Finished** | All steps completed successfully | No action needed. Review details if you want to verify outputs |
| **Failed** | One or more steps encountered an error and the run could not complete | Click **Explain** for a summary. Click **View** to inspect the failed step. Retrigger after fixing the root cause |
| **Running** | The workflow is currently in progress | Wait for it to complete. Refresh the page to see the updated status |
| **Pending** | The run is queued and waiting to start | No action needed — it will start automatically |
| **Skipped** | The run was intentionally skipped based on your workflow logic | No action needed. Skipped runs are expected — the workflow evaluated the event and determined no action was required |
***
## Row Controls
Every row has three interactive controls on the right-hand side. Together they give you full visibility and recovery capability without leaving the page.
Use this page to answer three core questions:
* **Did my integration run successfully?**
* **If something went wrong — which step failed and why?**
* **Can I replay a run without waiting for the next trigger?**
***
## Reading the Runs List
Each row in the table represents a single workflow execution.
| Column | What It Shows |
| ------------- | -------------------------------------------------------------------------------------------------- |
| **Reference** | The source record that triggered the run — e.g. `HubSpot Deal ID: 49649660024` |
| **ID** | The unique numeric identifier for this run — e.g. `33222`. Always include this in support requests |
| **Workflow** | The integration that executed — e.g. `HubSpot → Xero Invoice` |
| **Status** | The run outcome: `Finished`, `Failed`, `Running`, or `Pending` |
| **Started** | The date and time the run began executing |
***
## Run Status Reference
| Status | Meaning | What To Do |
| ------------ | --------------------------------------------------------------------- | -------------------------------------------------------------------------------------------------------------------- |
| **Finished** | All steps completed successfully | No action needed. Review details if you want to verify outputs |
| **Failed** | One or more steps encountered an error and the run could not complete | Click **Explain** for a summary. Click **View** to inspect the failed step. Retrigger after fixing the root cause |
| **Running** | The workflow is currently in progress | Wait for it to complete. Refresh the page to see the updated status |
| **Pending** | The run is queued and waiting to start | No action needed — it will start automatically |
| **Skipped** | The run was intentionally skipped based on your workflow logic | No action needed. Skipped runs are expected — the workflow evaluated the event and determined no action was required |
***
## Row Controls
Every row has three interactive controls on the right-hand side. Together they give you full visibility and recovery capability without leaving the page.
 **Click the speech-bubble icon**
Generates a plain-English AI summary of the run — what happened, which step failed, and likely cause. Use this first before reading technical logs.
**Click the eye icon**
Opens the full Workflow Run detail page — event payload, step-by-step execution log, duration, and the Re-run button.
**Click the three-dot menu**
Dropdown with two options: **Retrigger** (replay the run) and **View** (same as the eye icon).
***
## 💬 The Explain Button
Clicking the speech-bubble icon on any row generates an AI-powered plain-English explanation of that run — no JSON reading required.
Use **Explain** first on any failed run. It will tell you which step failed, why it failed, and whether you need to fix something in your source system before retriggering.
The explanation typically covers:
* Which step succeeded or failed
* The specific reason for the failure (e.g. a missing required field, an API authentication error, or a duplicate record check)
* Whether the failure is likely to resolve on retrigger or requires a data fix first
The **Explain** button is also available on the individual Run Detail page, positioned alongside the step logs so you can read both together.
***
## 👁 The Run Detail Page
Clicking the eye icon — or selecting **View** from the Actions menu — opens the full detail view for that run.
**Click the speech-bubble icon**
Generates a plain-English AI summary of the run — what happened, which step failed, and likely cause. Use this first before reading technical logs.
**Click the eye icon**
Opens the full Workflow Run detail page — event payload, step-by-step execution log, duration, and the Re-run button.
**Click the three-dot menu**
Dropdown with two options: **Retrigger** (replay the run) and **View** (same as the eye icon).
***
## 💬 The Explain Button
Clicking the speech-bubble icon on any row generates an AI-powered plain-English explanation of that run — no JSON reading required.
Use **Explain** first on any failed run. It will tell you which step failed, why it failed, and whether you need to fix something in your source system before retriggering.
The explanation typically covers:
* Which step succeeded or failed
* The specific reason for the failure (e.g. a missing required field, an API authentication error, or a duplicate record check)
* Whether the failure is likely to resolve on retrigger or requires a data fix first
The **Explain** button is also available on the individual Run Detail page, positioned alongside the step logs so you can read both together.
***
## 👁 The Run Detail Page
Clicking the eye icon — or selecting **View** from the Actions menu — opens the full detail view for that run.
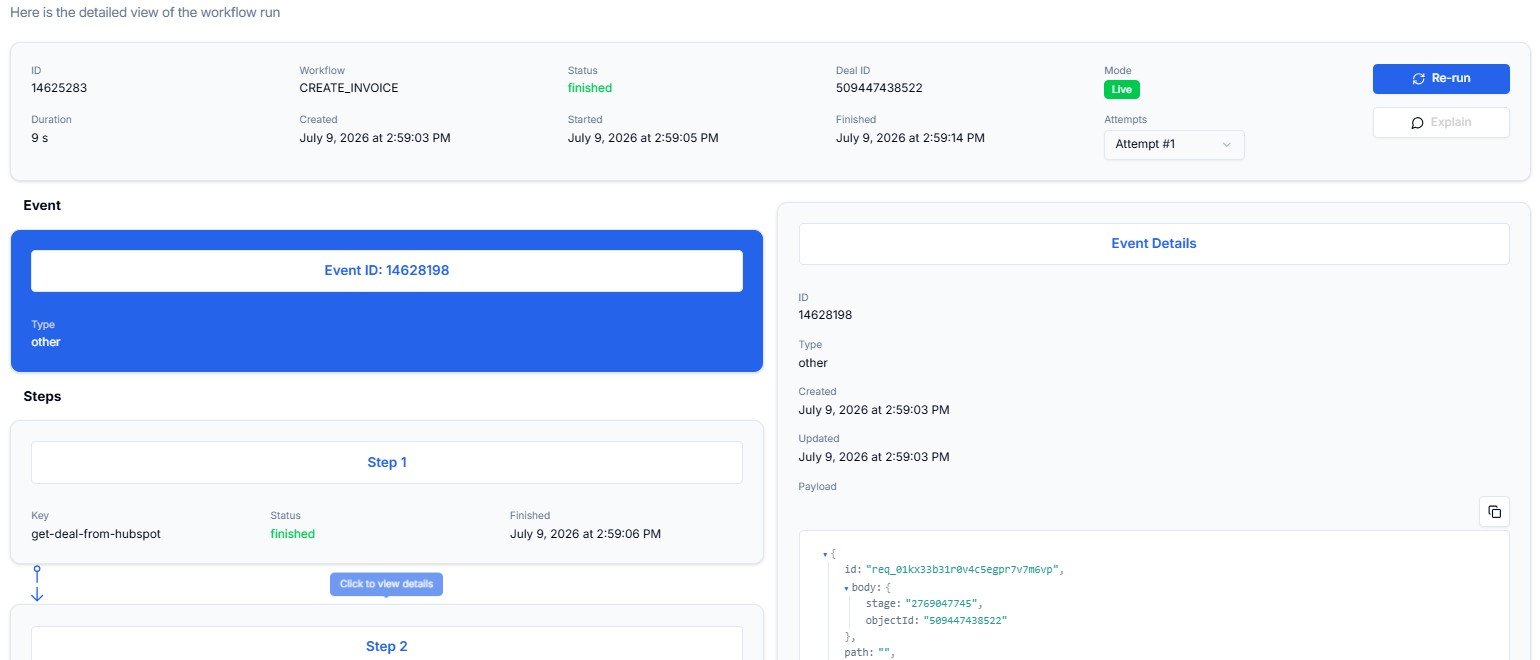 ### Run Metadata Header
The top section shows everything you need to know about the run at a glance.
| Field | What It Tells You |
| ------------------- | --------------------------------------------------------------------------------- |
| **ID** | The unique run identifier. Include this in any support request |
| **Workflow** | The name of the integration that was executed |
| **Status** | Final run state: `finished`, `failed`, `running`, or `pending` |
| **HubSpot Deal ID** | The source record that triggered this run |
| **Mode** | `Live` (production data) or `Test` (sandbox). Shown as a green or grey badge |
| **Duration** | Total time taken to complete all steps |
| **Created** | When the run record was first created in Lighthouse |
| **Started** | When Lighthouse began executing the workflow steps |
| **Finished** | When the final step completed (or failed) |
| **Attempts** | How many times Lighthouse attempted this run — useful for identifying retry loops |
### The Re-run Button
The blue **Re-run** button in the top-right replays the run using the **original stored event payload**.
**Re-run uses the data captured at the time of the original run.** If the source record in HubSpot has been updated since then, Re-run will execute using the old data — not the current values. Use **Retrigger** from the Actions menu if you want to re-fetch the latest record from the source system.
### The Event Block
The Event block identifies what triggered this run:
* **Event ID** — the internal ID of the incoming event that caused the workflow to start
* **Type** — the event category (e.g. `other`, `contact.created`, `deal.propertyChange`)
* **Click to view details** — expands the raw event payload panel on the right, showing the full JSON data Lighthouse received from the source app
### Steps — The Execution Log
The Steps section shows each action inside your workflow in sequence.
| Element | What It Shows |
| ------------------------- | ---------------------------------------------------------------------------------------- |
| **Step number** | Steps run in order from top to bottom — Step 1, Step 2, Step 3... |
| **Key** | The internal name of the step — e.g. `fetch-deal-details`, `find-or-create-xero-contact` |
| **Status** | Whether this individual step `finished`, `failed`, or is still `running` |
| **Finished** | The exact time this step completed |
| **Click to view details** | Expands inline to show the step's input data, output data, and any error message |
When a run fails, scroll through the Steps list to find the **first step with a red status** — that is where the problem occurred. Expand it using **Click to view details** to read the error message and the data that was passed into that step. This almost always reveals the root cause.
### Event Details Panel
The right-hand panel shows the raw JSON payload of the selected event or step — the exact data Lighthouse received from or sent to the connected system. Use this panel to:
* Verify that the correct HubSpot deal properties were captured
* Check that field values match what your destination app (e.g. Xero) requires
* Copy the payload to share with the Cloudify support team
***
## The Actions Menu
Click the three-dot menu on any row to access two actions: **Retrigger** and **View**.
### Run Metadata Header
The top section shows everything you need to know about the run at a glance.
| Field | What It Tells You |
| ------------------- | --------------------------------------------------------------------------------- |
| **ID** | The unique run identifier. Include this in any support request |
| **Workflow** | The name of the integration that was executed |
| **Status** | Final run state: `finished`, `failed`, `running`, or `pending` |
| **HubSpot Deal ID** | The source record that triggered this run |
| **Mode** | `Live` (production data) or `Test` (sandbox). Shown as a green or grey badge |
| **Duration** | Total time taken to complete all steps |
| **Created** | When the run record was first created in Lighthouse |
| **Started** | When Lighthouse began executing the workflow steps |
| **Finished** | When the final step completed (or failed) |
| **Attempts** | How many times Lighthouse attempted this run — useful for identifying retry loops |
### The Re-run Button
The blue **Re-run** button in the top-right replays the run using the **original stored event payload**.
**Re-run uses the data captured at the time of the original run.** If the source record in HubSpot has been updated since then, Re-run will execute using the old data — not the current values. Use **Retrigger** from the Actions menu if you want to re-fetch the latest record from the source system.
### The Event Block
The Event block identifies what triggered this run:
* **Event ID** — the internal ID of the incoming event that caused the workflow to start
* **Type** — the event category (e.g. `other`, `contact.created`, `deal.propertyChange`)
* **Click to view details** — expands the raw event payload panel on the right, showing the full JSON data Lighthouse received from the source app
### Steps — The Execution Log
The Steps section shows each action inside your workflow in sequence.
| Element | What It Shows |
| ------------------------- | ---------------------------------------------------------------------------------------- |
| **Step number** | Steps run in order from top to bottom — Step 1, Step 2, Step 3... |
| **Key** | The internal name of the step — e.g. `fetch-deal-details`, `find-or-create-xero-contact` |
| **Status** | Whether this individual step `finished`, `failed`, or is still `running` |
| **Finished** | The exact time this step completed |
| **Click to view details** | Expands inline to show the step's input data, output data, and any error message |
When a run fails, scroll through the Steps list to find the **first step with a red status** — that is where the problem occurred. Expand it using **Click to view details** to read the error message and the data that was passed into that step. This almost always reveals the root cause.
### Event Details Panel
The right-hand panel shows the raw JSON payload of the selected event or step — the exact data Lighthouse received from or sent to the connected system. Use this panel to:
* Verify that the correct HubSpot deal properties were captured
* Check that field values match what your destination app (e.g. Xero) requires
* Copy the payload to share with the Cloudify support team
***
## The Actions Menu
Click the three-dot menu on any row to access two actions: **Retrigger** and **View**.
 ### Retrigger vs Re-run — Which to Use
| Use **Retrigger** when... | Use **Re-run** when... |
| ------------------------------------------------------------------------------------ | ------------------------------------------------------------------------------------- |
| The source record in HubSpot has been updated since the original run | You want to replay the exact data that was captured at the time of the original run |
| You fixed a data issue and want the workflow to pick up the corrected values | The failure was a transient error (e.g. a timeout) with no data changes needed |
| You want to test whether a configuration change resolves the issue with current data | You want to confirm the original payload now processes correctly after a Cloudify fix |
**Retriggering a run that already succeeded will create a second execution.** For workflows that create records in Xero or other destination systems, this may produce duplicate entries. Always confirm the original run failed or produced incorrect output before retriggering.
***
## Customising the Table View
Click **View** in the top-right corner of the Workflow Runs list to open the **Toggle columns** panel. Use it to show or hide columns based on what you need.
### Retrigger vs Re-run — Which to Use
| Use **Retrigger** when... | Use **Re-run** when... |
| ------------------------------------------------------------------------------------ | ------------------------------------------------------------------------------------- |
| The source record in HubSpot has been updated since the original run | You want to replay the exact data that was captured at the time of the original run |
| You fixed a data issue and want the workflow to pick up the corrected values | The failure was a transient error (e.g. a timeout) with no data changes needed |
| You want to test whether a configuration change resolves the issue with current data | You want to confirm the original payload now processes correctly after a Cloudify fix |
**Retriggering a run that already succeeded will create a second execution.** For workflows that create records in Xero or other destination systems, this may produce duplicate entries. Always confirm the original run failed or produced incorrect output before retriggering.
***
## Customising the Table View
Click **View** in the top-right corner of the Workflow Runs list to open the **Toggle columns** panel. Use it to show or hide columns based on what you need.
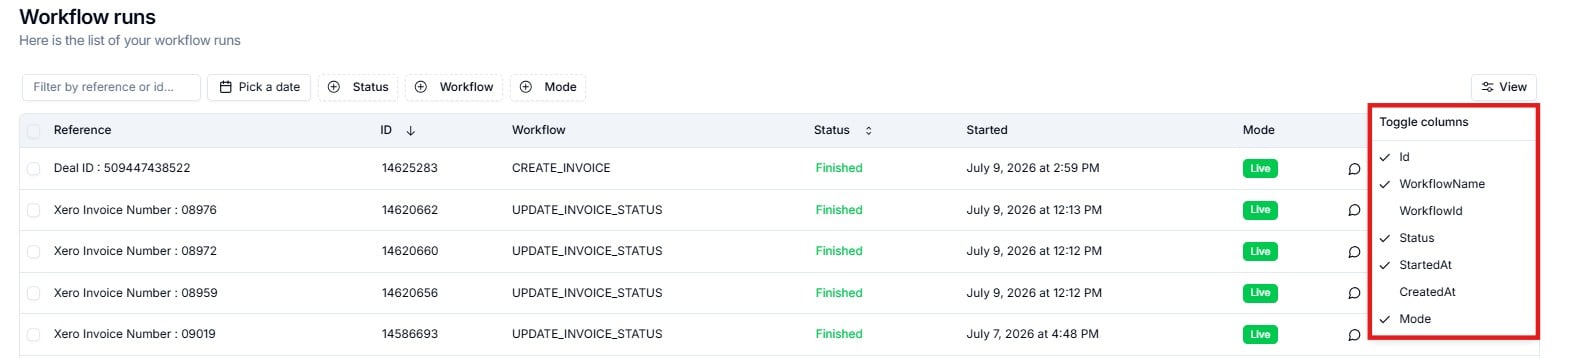 | Column | What It Shows | When to Enable It |
| ---------------- | --------------------------------------------- | ------------------------------------------------------- |
| **Id** | The unique run ID | Always — useful for referencing runs in support |
| **WorkflowName** | The name of the integration | Always — essential when running multiple workflows |
| **WorkflowId** | The internal workflow definition ID | Only when debugging with Cloudify support |
| **Status** | The run outcome | Always — core to daily monitoring |
| **StartedAt** | When the run began | Always — sort by this to see the most recent runs first |
| **CreatedAt** | When the run record was created in Lighthouse | Optional — differs from StartedAt only for queued runs |
| **Mode** | Live or Test execution context | Enable when running tests alongside live workflows |
**Recommended default:** Enable `Id`, `WorkflowName`, `Status`, and `StartedAt`. Add `Mode` during active testing to clearly separate sandbox runs from production runs in the list.
***
## Filtering Runs
Use the filter bar at the top of the list to narrow down what you see.
| Column | What It Shows | When to Enable It |
| ---------------- | --------------------------------------------- | ------------------------------------------------------- |
| **Id** | The unique run ID | Always — useful for referencing runs in support |
| **WorkflowName** | The name of the integration | Always — essential when running multiple workflows |
| **WorkflowId** | The internal workflow definition ID | Only when debugging with Cloudify support |
| **Status** | The run outcome | Always — core to daily monitoring |
| **StartedAt** | When the run began | Always — sort by this to see the most recent runs first |
| **CreatedAt** | When the run record was created in Lighthouse | Optional — differs from StartedAt only for queued runs |
| **Mode** | Live or Test execution context | Enable when running tests alongside live workflows |
**Recommended default:** Enable `Id`, `WorkflowName`, `Status`, and `StartedAt`. Add `Mode` during active testing to clearly separate sandbox runs from production runs in the list.
***
## Filtering Runs
Use the filter bar at the top of the list to narrow down what you see.
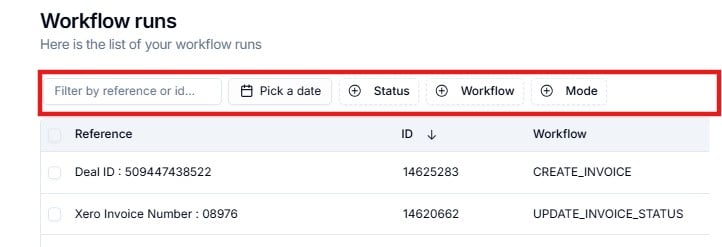 | Filter | Use It To |
| --------------- | ------------------------------------------------------------------------------------------------------------------------------------------------------- |
| **Search box** | Search by reference (e.g. a HubSpot Deal ID) or by run ID — useful when a client reports an issue with a specific record |
| **Pick a date** | Filter by a specific date or date range — use this to investigate incidents from a particular day |
| **Status** | Show only runs with a specific status — `Pending`, `Running`, `Finished`, `Failed`, or `Skipped`. Set to `Failed` to surface all current issues at once |
| **Workflow** | Filter by integration name — useful when multiple workflows are active and you want to isolate one |
| **Mode** | Filter by `Live` or `Test` — separates production runs from sandbox runs during setup and testing |
***
## Quick Reference — Common Scenarios
1. Click **💬 Explain** (speech-bubble icon) on the row for a plain-English summary.
2. Click **👁 View** (eye icon) to open the detail page.
3. In the Steps section, find the first step with a red status.
4. Expand it using **Click to view details** to read the error message.
5. Fix the root cause in the source system (e.g. HubSpot), then use **⋯ → Retrigger**.
Use **⋯ → Retrigger** from the Actions menu. This re-fetches the latest record from HubSpot and runs the workflow from scratch using the updated data. Do not use Re-run — it replays the original (now outdated) payload.
Open the detail page using **👁 View** and click the blue **Re-run** button. This replays the original event payload without re-fetching from HubSpot — correct when the data was fine but the execution failed transiently.
In the filter bar, set **Status** to `Failed` and click **Pick a date** to select the relevant date. The list will show only failed runs from that day.
Open the detail page using **👁 View**. In the Steps section, find the step that writes to Xero (e.g. `create-xero-invoice`). Expand it using **Click to view details**. The right-hand Event Details panel shows the exact output data that was sent.
Open the detail page and note the **Run ID** from the metadata header. In the Event Details panel, copy the relevant payload using the copy icon. Include both the Run ID and the payload in your support ticket — this lets Cloudify investigate immediately without additional back-and-forth.
Pending means the run is queued and waiting for Lighthouse to start processing it. This is typically temporary — refresh the page after a few moments. If a run stays Pending for an extended period, raise a support ticket.
***
| Filter | Use It To |
| --------------- | ------------------------------------------------------------------------------------------------------------------------------------------------------- |
| **Search box** | Search by reference (e.g. a HubSpot Deal ID) or by run ID — useful when a client reports an issue with a specific record |
| **Pick a date** | Filter by a specific date or date range — use this to investigate incidents from a particular day |
| **Status** | Show only runs with a specific status — `Pending`, `Running`, `Finished`, `Failed`, or `Skipped`. Set to `Failed` to surface all current issues at once |
| **Workflow** | Filter by integration name — useful when multiple workflows are active and you want to isolate one |
| **Mode** | Filter by `Live` or `Test` — separates production runs from sandbox runs during setup and testing |
***
## Quick Reference — Common Scenarios
1. Click **💬 Explain** (speech-bubble icon) on the row for a plain-English summary.
2. Click **👁 View** (eye icon) to open the detail page.
3. In the Steps section, find the first step with a red status.
4. Expand it using **Click to view details** to read the error message.
5. Fix the root cause in the source system (e.g. HubSpot), then use **⋯ → Retrigger**.
Use **⋯ → Retrigger** from the Actions menu. This re-fetches the latest record from HubSpot and runs the workflow from scratch using the updated data. Do not use Re-run — it replays the original (now outdated) payload.
Open the detail page using **👁 View** and click the blue **Re-run** button. This replays the original event payload without re-fetching from HubSpot — correct when the data was fine but the execution failed transiently.
In the filter bar, set **Status** to `Failed` and click **Pick a date** to select the relevant date. The list will show only failed runs from that day.
Open the detail page using **👁 View**. In the Steps section, find the step that writes to Xero (e.g. `create-xero-invoice`). Expand it using **Click to view details**. The right-hand Event Details panel shows the exact output data that was sent.
Open the detail page and note the **Run ID** from the metadata header. In the Event Details panel, copy the relevant payload using the copy icon. Include both the Run ID and the payload in your support ticket — this lets Cloudify investigate immediately without additional back-and-forth.
Pending means the run is queued and waiting for Lighthouse to start processing it. This is typically temporary — refresh the page after a few moments. If a run stays Pending for an extended period, raise a support ticket.
***